
U.S. is the world’s top consumer of oil, but Chinese demand has more than quadrupled since 1998
Petroleum and other liquid fuels consumption (million barrels per day)
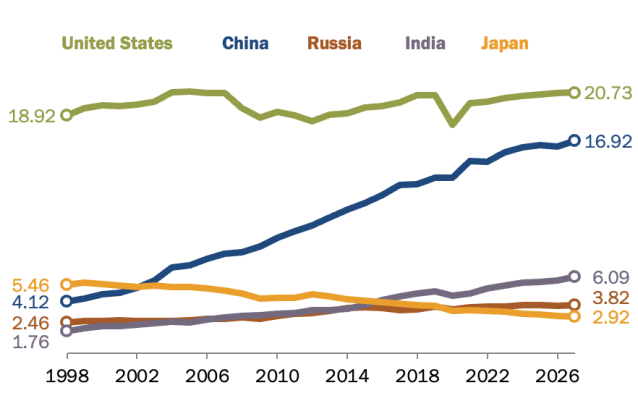
Note: Select top oil-consuming countries are shown. Data for Saudi Arabia is not available. EIA projections begin in 2025 for China, India and Russia and 2026 for Japan and the U.S.
Source: U.S. Energy Information Administration, “Short Term Energy Outlook Data Browser” (accessed June 26, 2026).
PEW RESEARCH CENTER
U.S. is the world’s top consumer of oil, but Chinese demand has more than quadrupled since 1998
Petroleum and other liquid fuels consumption (million barrels per day)
| Year | United States | China | Russia | India | Brazil | Japan |
|---|---|---|---|---|---|---|
| 1998 | 18.92 | 4.12 | 2.46 | 1.76 | 2.11 | 5.46 |
| 1999 | 19.52 | 4.36 | 2.54 | 1.96 | 2.16 | 5.6 |
| 2000 | 19.7 | 4.69 | 2.56 | 2.18 | 2.2 | 5.47 |
| 2001 | 19.65 | 4.81 | 2.6 | 2.17 | 2.19 | 5.37 |
| 2002 | 19.76 | 5.21 | 2.58 | 2.26 | 2.17 | 5.27 |
| 2003 | 20.03 | 5.79 | 2.59 | 2.36 | 2.12 | 5.38 |
| 2004 | 20.73 | 6.8 | 2.58 | 2.48 | 2.19 | 5.27 |
| 2005 | 20.8 | 6.97 | 2.62 | 2.47 | 2.24 | 5.29 |
| 2006 | 20.69 | 7.49 | 2.73 | 2.65 | 2.28 | 5.16 |
| 2007 | 20.68 | 7.92 | 2.71 | 2.85 | 2.43 | 4.99 |
| 2008 | 19.5 | 8.04 | 2.85 | 2.95 | 2.59 | 4.74 |
| 2009 | 18.77 | 8.5 | 2.75 | 3.02 | 2.6 | 4.33 |
| 2010 | 19.18 | 9.18 | 2.97 | 3.14 | 2.82 | 4.4 |
| 2011 | 18.9 | 9.69 | 3.13 | 3.22 | 2.89 | 4.42 |
| 2012 | 18.48 | 10.17 | 3.18 | 3.4 | 3 | 4.68 |
| 2013 | 18.97 | 10.78 | 3.35 | 3.42 | 3.14 | 4.52 |
| 2014 | 19.1 | 11.42 | 3.61 | 3.55 | 3.28 | 4.29 |
| 2015 | 19.53 | 11.96 | 3.66 | 3.85 | 3.24 | 4.17 |
| 2016 | 19.69 | 12.56 | 3.58 | 4.23 | 3.1 | 4.04 |
| 2017 | 19.95 | 13.36 | 3.44 | 4.53 | 3.15 | 3.94 |
| 2018 | 20.51 | 13.44 | 3.46 | 4.77 | 3.08 | 3.85 |
| 2019 | 20.54 | 13.97 | 3.71 | 4.92 | 3.02 | 3.75 |
| 2020 | 18.19 | 13.98 | 3.49 | 4.56 | 2.84 | 3.35 |
| 2021 | 19.89 | 15.29 | 3.67 | 4.73 | 2.97 | 3.4 |
| 2022 | 20.01 | 15.23 | 3.72 | 5.13 | 3.08 | 3.34 |
| 2023 | 20.28 | 15.98 | 3.72 | 5.38 | 3.16 | 3.29 |
| 2024 | 20.46 | 16.37 | 3.8 | 5.6 | 3.27 | 3.14 |
| 2025 | 20.61 | 16.58 | 3.83 | 5.67 | 3.36 | 3.07 |
| 2026 | 20.68 | 16.43 | 3.77 | 5.76 | 3.39 | 2.96 |
| 2027 | 20.73 | 16.92 | 3.82 | 6.09 | 3.45 | 2.92 |
Note: Select top oil-consuming countries are shown. Data for Saudi Arabia is not available. EIA projections begin in 2025 for China, India and Russia and 2026 for Japan and the U.S.
Source: U.S. Energy Information Administration, “Short Term Energy Outlook Data Browser” (accessed June 26, 2026).
PEW RESEARCH CENTER
